Highsoft
Highcharts
WHAT IS HIGHCHARTS?
Highcharts is a charting library written in pure JavaScript, offering an easy way of adding interactive charts to your web site or web application. Highcharts currently supports line, spline, area, areaspline, column, bar, pie, scatter, angular gauges, arearange, areasplinerange, columnrange, bubble, box plot, error bars, funnel, waterfall and polar chart types.
FEATURES
COMPATIBLE
It works in all modern mobile and desktop browsers including the iPhone/iPad and Internet Explorer from version 6. On iOS and Android, multitouch support provides a seamless user experience. Standard browsers use SVG for the graphics rendering. In legacy Internet Explorer graphics are drawn using VML
FREE FOR NON-COMMERCIAL
Do you want to use Highcharts for a personal website, a school site or a non-profit organisation? Then you don't need the author's permission, just go on and use Highcharts. For commercial websites and projects, see License and Pricing.
OPEN
One of the key features of Highcharts is that under any of the licenses, free or not, you are allowed to download the source code and make your own edits. This allows for personal modifications and a great flexibility.
PURE JAVASCRIPT
Highcharts is solely based on native browser technologies and doesn't require client side plugins like Flash or Java. Furthermore you don't need to install anything on your server. No PHP or ASP.NET. Highcharts needs only two JS files to run: The highcharts.js core and either the jQuery, MooTools or Prototype framework. One of these frameworks is most likely already in use in your web page.
NUMEROUS CHART TYPES
Highcharts supports line, spline, area, areaspline, column, bar, pie, scatter, angular gauges, arearange, areasplinerange, columnrange and polar chart types. Many of these can be combined in one chart.
SIMPLE CONFIGURATION SYNTAX
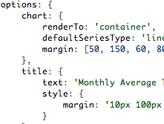
Setting the Highcharts configuration options requires no special programming skills. The options are given in a JavaScript object notation structure, which is basically a set of keys and values connected by colons, separated by commas and grouped by curly brackets.
DYNAMIC
Through a full API you can add, remove and modify series and points or modify axes at any time after chart creation. Numerous events supply hooks for programming against the chart. In combination with jQuery, MooTools or Prototype's Ajax API, this opens for solutions like live charts constantly updating with values from the server, user supplied data and more.
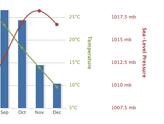
MULTIPLE AXES
Sometimes you want to compare variables that are not the same scale – for example temperature versus rainfall and air pressure. Highcharts lets you assign an y axis for each series – or an x axis if you want to compare data sets of different categories. Each axis can be placed to the right or left, top or bottom of the chart. All options can be set individually, including reversing, styling and position.
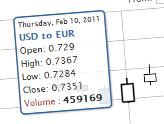
TOOLTIP LABELS
On hovering the chart Highcharts can display a tooltip text with information on each point and series. The tooltip follows as the user moves the mouse over the graph, and great efforts have been taken to make it stick to the nearest point as well as making it easy to read a point that is below another point.
DATETIME AXIS
75% of all charts with an X and Y axis have a date-time X axis. Therefore Highchart is very intelligent about time values. With milliseconds axis units, Highcharts determines where to place the ticks so that they always mark the start of the month or the week, midnight and midday, the full hour etc.
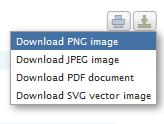
EXPORT AND PRINT
With the exporting module enabled, your users can export the chart to PNG, JPG, PDF or SVG format at the click of a button, or print the chart directly from the web page.
ZOOMING
By zooming in on a chart you can examine an especially interesting part of the data more closely. Zooming can be in the X or Y dimension, or both.
EXTERNAL DATA LOADING
Highcharts takes the data in a JavaScript array, which can be defined in the local configuration object, in a separate file or even on a different site. Furthermore, the data can be handled over to Highcharts in any form, and a callback function used to parse the data into an array.
ANGULAR GAUGES
Ideal for dashboards, angular gauges provides speedometer-like charts, easy to read at a quick glance.
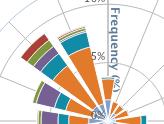
POLAR CHARTS
Cartesian chart types like line, area, spline or areaspline can be converted to polar or radial chart by one simple option.
INVERTED CHART OR REVERSED AXIS
Sometimes you need to flip over your chart and make the X axis appear vertical, like for example in a bar chart. Reversing the axis, with the highest values appearing closest to origo, is also supported.
TEXT ROTATION FOR LABELS
Highstock
WHAT IS HIGHSTOCK?
Highstock lets you create stock or general timeline charts in pure JavaScript, including sophisticated navigation options like a small navigator series, preset date ranges, date picker, scrolling and panning.
HIGHSTOCK FEATURES
COMPATIBLE
It works in all modern browsers including the iPhone/iPad and Internet Explorer from version 6. Standard browsers use SVG for the graphics rendering. In legacy Internet Explorer graphics are drawn using VML.
FREE FOR NON-COMMERCIAL
Do you want to use Highstock for a personal website, a school site or a non-profit organisation? Then you don't need the author's permission, just go on and use Highstock. For commercial websites and projects, see License and Pricing.
OPEN
One of the key features of Highstock is that under any of the licenses, free or not, you are allowed to download the source code and make your own edits. This allows for personal modifications and a great flexibility.
PURE JAVASCRIPT
Highstock is solely based on native browser technologies and doesn't require client side plugins like Flash or Java. Furthermore you don't need to install anything on your server. No PHP or ASP.NET. Highstock needs only two JS files to run: The highstock.js core and either the jQuery, MooTools or Prototype framework. One of these frameworks is most likely already in use in your web page.
NUMEROUS CHART TYPES
Highstock supports line, spline, area, areaspline, column, scatter, OHLC, candlestick, flags, arearange, areasplinerange and columnrange chart types. Any of these can be combined in one chart.
SIMPLE CONFIGURATION SYNTAX
Setting the Highstock configuration options requires no special programming skills. The options are given in a JavaScript object notation structure, which is basically a set of keys and values connected by colons, separated by commas and grouped by curly brackets.
DYNAMIC
Through a full API you can add, remove and modify series and points or modify axes at any time after chart creation. Numerous events supply hooks for programming against the chart. In combination with jQuery, MooTools or Prototype's Ajax API, this opens for solutions like live charts constantly updating with values from the server, user supplied data and more.
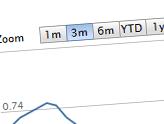
RANGE SELECTOR
While navigating a large dataset, perhaps hourly values over several years, it is important for the charting library to provide a quick way a to view a certain time range. Highstock provides a range selector where the user can zoom in on preselected time ranges like 1m, 1y or YTD, or manually add date ranges.
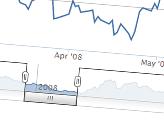
SCROLLBAR AND NAVIGATOR
Another, more visual way of navigating the data set is by dragging the scrollbar, or dragging the edges of the Navigator window to the area of special interst.
EVENT MARKER FLAGS
Through a specific series type called "flags", you can add event markers and annotations directly related to an interesting are on the series. You can add different visual styles to the markers to differentiate them, and you can add them to the graph or the X axis.
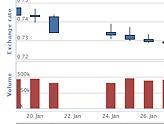
MULTIPLE AXES
Sometimes you want to compare variables that are not the same scale. Highstock lets you assign an y axis for each series. Each axis can be placed to the right or left, or next to other axes. All options can be set individually, including reversing, styling and position.
TOOLTIP LABELS
On hovering the chart Highstock can display a tooltip text with information on each point and series. The tooltip follows as the user moves the mouse over the graph, making it easy and intuitive to read out the values from the chart.
DATETIME AXIS
Highstock is very intelligent about time values. With milliseconds axis units, Highstock determines where to place the ticks so that they always mark the start of the month or the week, midnight and midday, the full hour etc.
DATA GROUPING
If your data array consists of 100,000 points, it wouldn't be very effective for the browser to calculate the translated position for each one and display a graph with 100,000 points on what is often a 800px wide canvas. In comes the Highstock data grouping facility, where the data is blazingly fast grouped into optional groups like months or days, and displayed. When zooming in on smaller ranges, the grouping is redone and you can inspect the full resolution data.
EXPORT AND PRINT
With the exporting module enabled, your users can export the chart to PNG, JPG, PDF or SVG format at the click of a button, or print the chart directly from the web page.
ZOOMING AND PANNING
In addition to controling the zooming and panning from the scroller and navigator, you have the option to set mouse and finger zooming and panning.
EXTERNAL DATA LOADING
Highstock takes the data in a JavaScript array, which can be defined in the local configuration object, in a separate file or even on a different site. Furthermore, the data can be handed over to Highstock in any form, and a callback function used to parse the data into an array.
Highmaps
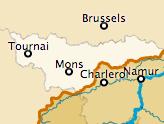
WHAT IS HIGHMAPS?
Highmaps is a HTML5 mapping component optimized for creating schematic maps in web based projects. It extends the user friendly Highcharts JavaScript API and allows web developers to build interactive maps to display sales, election results or any other information linked to geography. Perfect for standalone use or in dashboards in combination with Highcharts!
FEATURES
MOBILE FRIENDLY
Highmaps is designed from ground up with mobile browsers in mind. Everything from multitouch zooming to touch-friendly tooltips responds great on mobile platforms. Nevertheless, Highmaps also works in old browsers like IE6-8.
MAP COLLECTION
For your convenience, we provide a collection of hundreds of maps, all optimized for fast download and rendering with Highmaps.
FREE FOR NON-COMMERCIAL
Do you want to use Highmaps for a personal website, a school site or a non-profit organisation? Then you don't need the author's permission, just go on and use Highmaps. For commercial websites and projects, see License and Pricing.
OPEN
One of the key features of Highmaps is that under any of the licenses, free or not, you are allowed to download the source code and make your own edits. This allows for personal modifications and a great flexibility.
PURE JAVASCRIPT
Highmaps is solely based on native browser technologies and doesn't require client side plugins like Flash or Java. Furthermore you don't need to install anything on your server. No PHP or ASP.NET. Highmaps needs only two JS files to run: The highmaps.js core and either jQuery or the Highcharts Standalone Framework.
DYNAMIC
Through a full API you can add, remove and modify series and points or modify axes at any time after chart creation. Numerous events supply hooks for programming against the chart. In combination with jQuery's or other frameworks' Ajax APIs, this opens for solutions like live charts constantly updating with values from the server, user supplied data and more.
VARIOUS MAP TYPES
Map area, map line, points of interest, bubbles on maps, heatmaps. These features correspond to series types in Highcharts.
COLOR AXIS
For full control over the color layout of the Highmaps choropleth maps, a separate color axis is displayed inside the legend. It inherits most features from scalar axes in order to provide common options like min, max, logarithic scale and more.
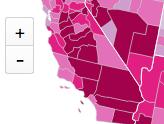
NAVIGATION
Highmaps features all common ways of navigating, like plus/minus buttons, doubleclick to zoom, mousewheel zooming, multitouch and panning.
DRILLDOWN
The drilldown module ensures smooth interaction between map areas on one layer, which zoom into a full map on the underlying layer. Let your users click their way down into increasingly local data!
GEOJSON SUPPORT
Besides the common Series/Point concept, Highmaps accepts the standardized GeoJSON format for map input.
EXPORT AND PRINT
With the exporting module enabled, your users can export the chart to PNG, JPG, PDF or SVG format at the click of a button, or print the chart directly from the web page.
Highcharts Cloud
The visual editor and hosting platform for the world's best web charting tool.
♦ SOLID FOUNDATION
Highcharts Cloud is built on top of Highcharts JS, a JavaScript API for developers to easily create interactive online charts. It is currently used by 61 of the Global Fortune 100 companies as well as tens of thousands of other clients, like Facebook, Twitter, Groupon, Citi and Verizon.
♦ FOR NON-TECHIES
With the Highcharts Cloud, the extreme flexibility of Highcharts becomes available for content producers. Journalists, bloggers and designers can create charts without learning to write code. Even developers using the Cloud can set up their prototypes quick and easy, and copy the generated code into their projects.
♦ SOCIAL BY DESIGN
Once you've set up your charts, you can easily embed them into your web projects or blogs, or share them to social media. The charts are served from Amazon.
Software Sources Ltd. is serving as Highsoft Reseller.